Introducing NordicClick’s GA4 Quick View Looker Studio Report
Google Analytics 4 (GA4) is now the industry standard for monitoring and analyzing web traffic. It has a lot to offer, but the key to unlocking its full potential lies in careful planning and proper setup—an area where many businesses fall short.
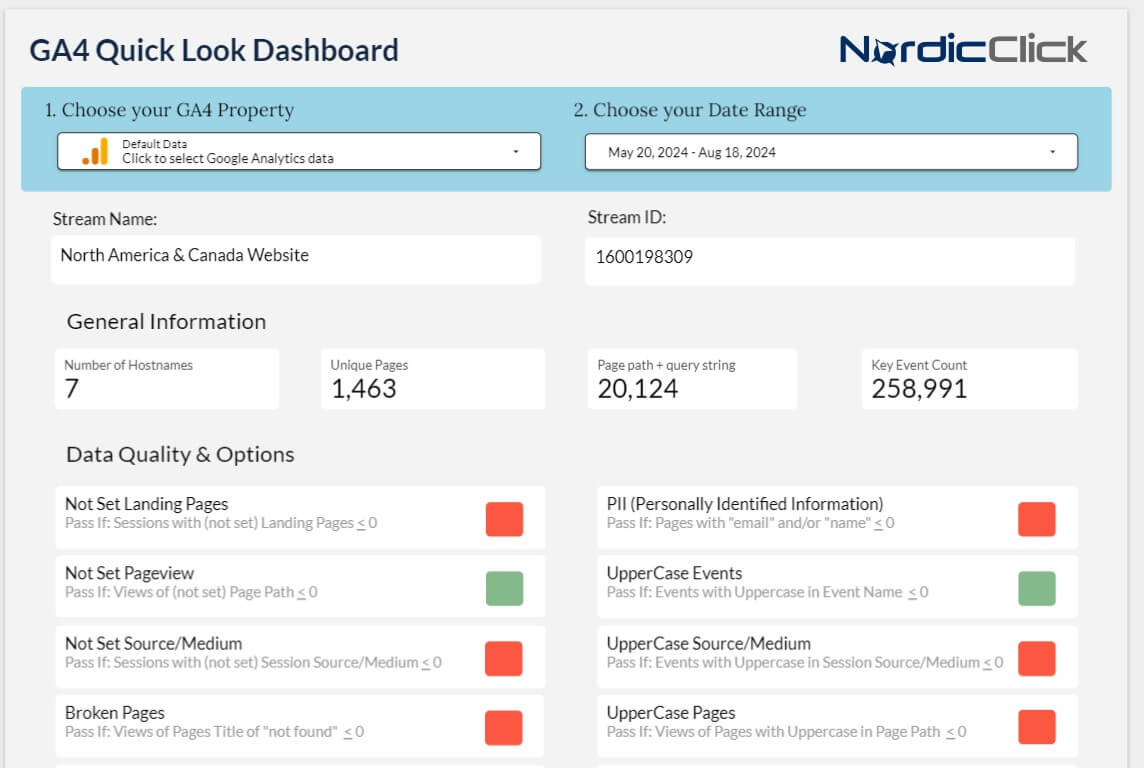
Often, businesses aren’t fully aware of the gaps in their GA4 setup. To address this, we’ve introduced NordicClick’s GA4 Quick View Looker Studio Report, designed to give you a clear, comprehensive overview of your GA4 data, helping you ensure that everything is functioning as it should.

This report ensures you’re fully leveraging all the visibility and tracking features GA4 offers. Within the report, you’ll see sections highlighted in red or green, indicating a pass or fail status. Red indicators aren’t always negative. For instance, if you see red for e-commerce events but don’t run an e-commerce site, it’s not a concern.
The report is divided into four sections:
- Summary
- Data Quality & Option Details
- Events Details
- E-Commerce Details (if applicable)
If you look at your GA4 data and feel it’s not right, this report is like getting the code readout for the check engine light on your car. It doesn’t tell you exactly what’s wrong or how to fix it, but it can point you in the right direction.
Using this Report:
We’ve made this report simple to use. Just follow these three easy steps:
Step One: Click on the link: https://lookerstudio.google.com/reporting/3e617402-dfed-49f7-8c46-30e0ea95ba1e/page/p_tzmg1uy2id
As long as the link is pasted into a browser logged into a Google account connected to a GA4 property, you will be able to access the data.
Step Two: Pick your property. If you only have one, it’ll be the default. If you’re an agency or consultant, just pick the one you want to see.
Step Three: Pick your date range.
IMPORTANT NOTE: The larger the date range you select, the longer it will take to generate the information.
Pro Tip: A 90-day lookback is sufficient in most cases. However, if you made changes to your website on a specific date (e.g., July 1), set your lookback to that date. Also, if you’ve made recent changes, wait 48 hours before running the report to ensure accurate data.
What the Report Reveals:
After selecting the property and date range, the report will provide insights such as:
- How many hostnames (unique domains and subdomains) are being tracked in your GA4 property.
- Whether you’re experiencing the dreaded “(not set)” for landing pages, pageviews, source mediums, etc.
- If you’re tracking video events on your site (assuming your site has video, of course).
- How many unique pages were viewed during that time frame. You’ll also see the page path with the query string, which is especially useful for tracking various campaigns. For instance, if you’re running LinkedIn ads, the URL might look like: www.linkedin.com/?/UTM=______/source=_______. For Google Ads, you’ll see the addition o
The point is, there are many different query strings involved in tracking campaigns, and this report provides a quick glance to ensure they’re being used properly.
Seeing Red:
If you see red, it doesn’t necessarily mean something is wrong. It could simply indicate that you’re not using features like demographics data or content groupings. This is neither good nor bad—it’s just a choice.
What’s Next?
Grab the Quick View Report here Check it out for yourself and if you see red where you think you should see green, it’s time to dive deeper to identify and resolve the issues. If you need assistance, contact us today to request a no-obligation, 25-minute analytics review.


