Google has announced that starting in July 2018, page speed will be a ranking factor for mobile searches conducted within the U.S. According to two different studies conducted by Google:
The average time it takes to fully load a mobile landing page is 22 seconds [1], yet 53% of visits are abandoned if a mobile site takes longer than three seconds to load. [2]
Look at your own website’s analytics data to confirm whether this is true for you, but typically your mobile conversion rate will be lower than that of people using a desktop device to navigate your website. Google believes the conversion rate on mobile directly ties to page load speeds. Therefore, improving the speed at which a page loads will directly impact the amount of revenue your website drives. Makes for a pretty solid business reason as to why webmasters should focus on improving this metric!
Establish a First-Party Baseline
You can’t measure success if you don’t know your website’s current performance. In this article, we will review the Google Analytics reports you can use to know where your site stands. (If you are interested in learning more about the third-party tools available, check out this post on mobile speed optimization.)
Google Analytics Site Speed Reports
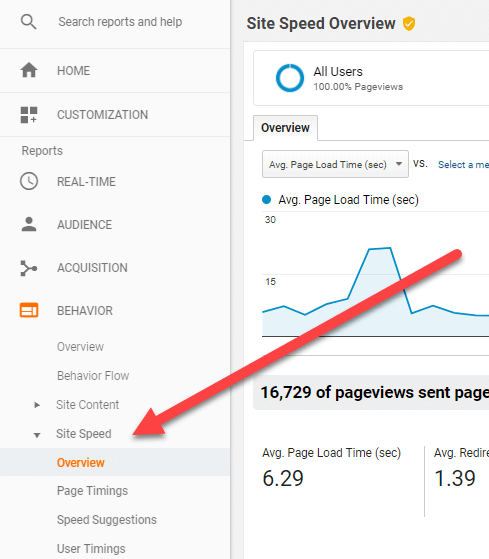
The Site Speed reports housed within Google Analytics (under the Behavior menu) reference a sample of your total pageviews to record how quickly website visitors can view and engage with your content on average.
As a website owner, you can use these reports to identify areas that need improvement, and then track the impact of those improvements.
Per Google, the Site Speed reports measure three aspects of latency: [3]
- Page-load time for a sample of pageviews on your site. You can view the data across different dimensions to see how quickly your pages loaded from a variety of perspectives (e.g. in different browsers, in different countries). Data is available in the Page Timings report.
- Execution speed or load time of any discrete hit, event, or user interaction that you want to track (e.g. how quickly images load, response time to button clicks). Data is available in the User Timings report. Additional configuration is needed to enable this report.
- How quickly the browser parses the document and makes it available for user interaction. No additional configuration is required to see this data. Data is available in the Page Timings report, on the DOM Timings subtabs.
Caution: Sampled Data Ahead!
Before using these reports, it is critical to understand the metrics shown in these reports reference a sample of your total pageviews. When applying dimensions, site speed data can become so segmented it only represents a handful of pageviews. This does not provide a large enough data set to make optimization decisions from. Since there is likely a cost associated with improving page speed, allocate resources to the improvements that will drive the greatest impact. Always apply the secondary dimension “Page Load Sample” so you know exactly how many pageviews are being referenced to calculate the metrics.
Site Speed Sample Rate
The default rate at which Google will sample pageview data to populate these reports is 1% of total pageviews, up to 10,000 pageviews. This is set at the property level, within the Google Analytics tracking script. Webmasters have the option to increase the rate at which Google will sample data. A higher percentage could make this report more valuable if you have a single Google Analytics property tracking multiple subdomains on the same root domain that use differing web platforms, each with their own code base. A higher site speed sample rate will often allow you to glean insights for each subdomain since the sample size is higher collectively.
For example, the Google Analytics property (unfiltered) reports 25,000 pageviews per day, but your IT team wants to know the site speed of hits only on example.yoursite.com. Google’s default sample rate of 1% would provide data for only 250 pageviews. Increasing your sample rate to 50% would report out on 10,000 pageviews per day. (Note: this would total 12,500 pageviews sampled, but cannot be as this is above Google’s cap of 10,000 per day – even if you pay for Google Analytics.) Referencing 10,000 per day versus 250 enables you to segment by hostname and/or URL and still see a Page Load Sample high enough to draw conclusions from.
Page Timings Report
Per Google, you can use the Page Timings report to measure where load time is critically impacting your pages’ performance. [4]
For example, you might learn that your target audience is in a geographic area where the Internet connection speed is slower than what is optimal for your pages. Or, you might learn the load times for your pages vary widely in different browsers. With these insights, you can take steps to improve your site performance in a very targeted way.
If by looking at the Page Timings Report you can pinpoint poor load time to a specific area, here are some recommendations to consider:
| ISSUE | RECOMMENDATION |
|---|---|
| Web Browser | Investigate browser issues to deliver more streamlined pages for certain browsers. |
| Geographic Region or ISP | Deliver alternate pages more suitable to lower bandwidth in key regions or ISPs. |
| Landing Page | Start by working to improve the landing pages with the most pageviews. |
| Overall Avg. Load Time | Determine the significance of the load time issue by exploring the spread across Page Load Time Buckets. |
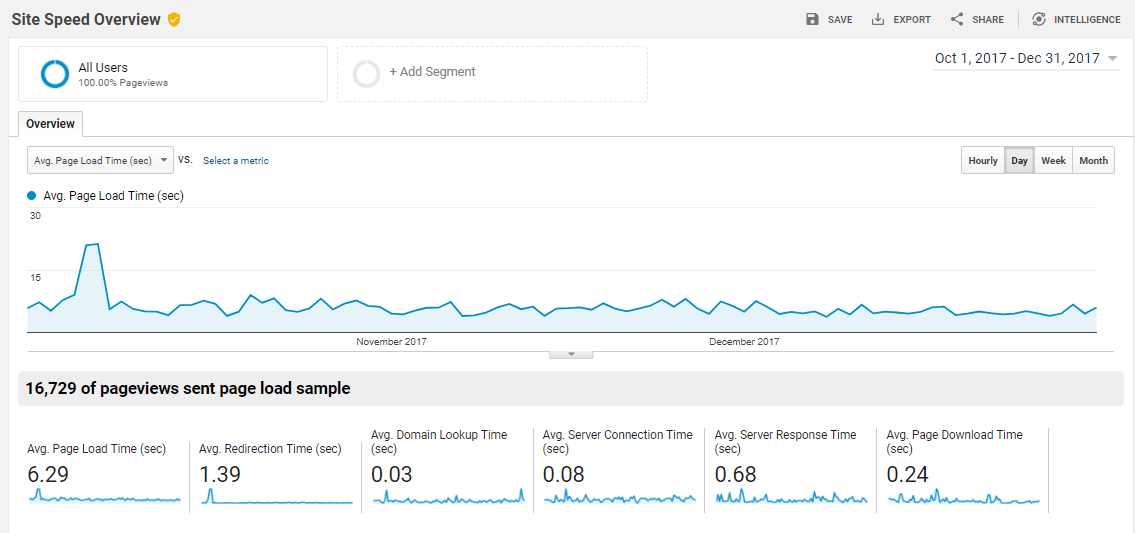
When deciding where to start, target the slowest speed metrics first (the ones with large values for load times). Specifically, if you have:
- High Avg. Redirection Time: Analyze whether the redirects are necessary. Also, check sources to see if a specific referrer is causing high redirect latency.
- High Avg. Domain Lookup Time: Consider changing to a DNS provider with consistent lower response times.
- High Avg. Server Response Time: Reduce backend processing time or place a server closer to users.
- High Avg. Page Download Time: Reduce your initial data size.
Google Analytics Custom Reports
A fundamental issue with the Google Analytics Page Timing Report is that Page Load Sample is not available as a metric within the table view, only as a “comparison” metric in the trendline chart.
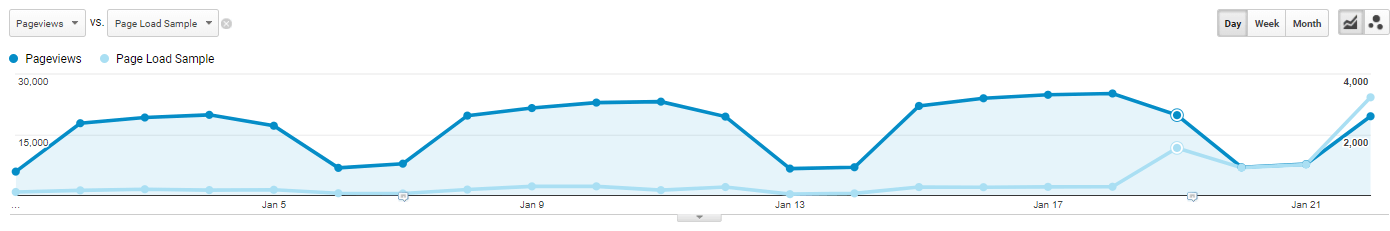
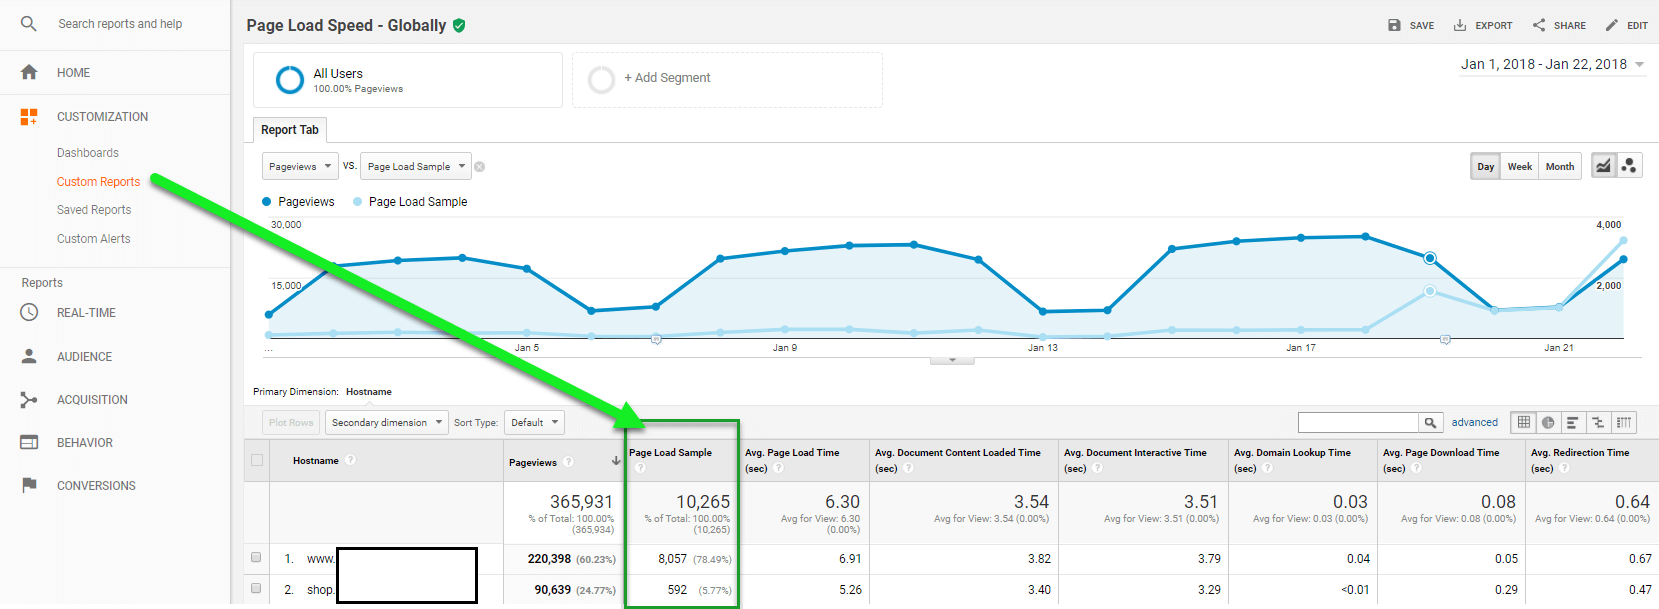
This means you can’t see how many pageviews were sampled to generate the metrics in the table. To drill into this level of segmentation for a dimension, add Page Load Sample as a metric within a Custom Report, as shown below.
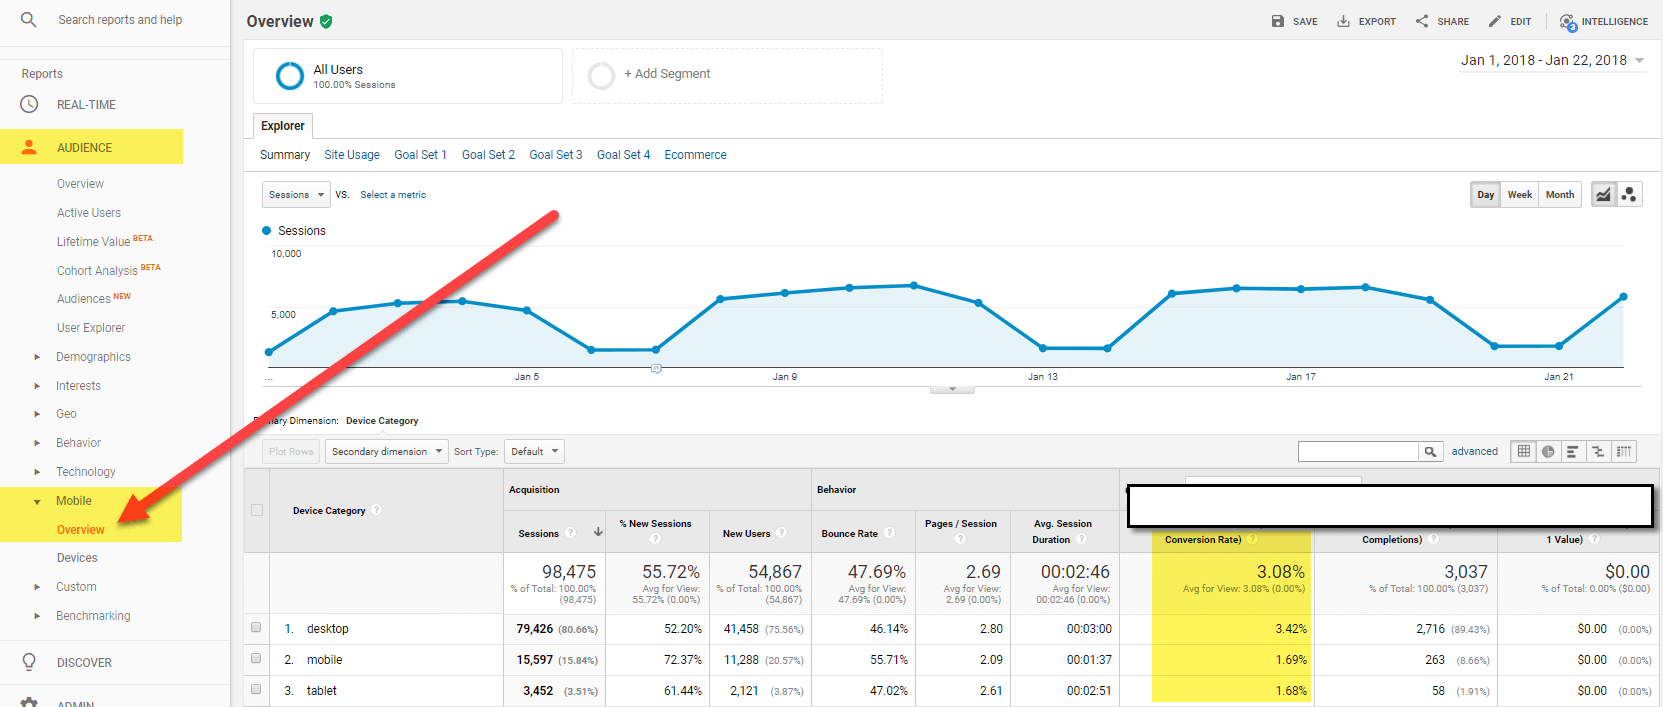
Conversion Rates by Device
To benchmark current conversion rates by device, you must have goals or e-commerce tracking enabled within the Google Analytics view you are using. Once goals are present and you have a large enough data set to reach statistical significance, navigate to Audience > Mobile > Overview. Within the conversions drop-down, select the goal number or e-commerce as the conversion type to find its conversion rate by device for the applicable date range.
How Google Analytics Reports Differ from Third-Party Page Speed Tests
You can also use third-party tools to gather recommendations for improving page load speeds, such as Google Page Speed Insights, TestMySite.ThinkWithGoogle.com, and the Chrome Browser.
The data these tools report will not match what you see in Google Analytics because these tools reference a single point in time, not an average of sampled first-party user data. Many variables impact the results of a third-party tool, such as the network, location, and time stamp of the report. But these tools are not meant to trend results nor provide historical records. They are meant to provide overarching recommendations for improvement.
Here are the key differences between what first-party reports from Google Analytics and third-party reports from Google Page Speed Insights provide:
| TYPE OF REPORT | GOOGLE ANALYTICS | GOOGLE PAGE SPEED INSIGHTS |
|---|---|---|
| US-Based | No | Yes |
| Country-level Data | Yes | No |
| Specific Page at a Single Point in Time | No | Yes |
| Historical Trending Averages | Yes | No |
| Sample of Larger Data Set | Yes | No |
| Suggestions for Improvement | No | Yes |
| Page-level Insights | Yes | No |
| Scores Page URL | Yes | Yes |
| Scoring System | Shows extent to which speed can be improved, not speed itself | Shows Fast, Slow or Average; plus FCP and DCL metrics based on Chrome User Experience Report data |
Summary
So where to begin? To uncover the technical issues to tackle to improve site speed, start with a third-party tool rather than referencing Google Analytics. Use a third-party tool like Google PageSpeed Insights to see which items are holding up load times. We’d recommend this because:
- Findings are universal and based on how the site is built and/or hosted.
- Addressing the findings from third-party tools should improve site speed globally – regardless of your user’s location. (For example, reducing an image’s file size will help in the US as well as in Australia, Mexico, Japan, or any other country.)
Once you’ve fixed the technical issues discovered from third-party site speed testing, then use Google Analytics to measure the impact. There you can segment by country, hostname, page URL, etc. to highlight any regional issues that could be caused by bandwidth/ISP issues, lack of a content delivery network, browser usage, and more.
Need a hand? We’re happy to help you establish your company’s benchmark via a Site Speed Audit to better understand the specific steps that need to be taken to improve page load speeds. While the changes made to Google’s algorithm are currently US-based, it will likely roll out globally soon. So be proactive! Now is the time to understand your site speed and avoid a drop in your Google mobile search rankings.
Wondering where you stand and how you can improve? Check out how we can help optimize your mobile experience and measure website performance!
References:
[1] Google Research, Webpagetest.org, Global, sample of more than 900,000 mWeb sites across Fortune 1000 and Small Medium Businesses. Testing was performed using Chrome and emulating a Nexus 5 device on a globally representative 3G connection. 1.6Mbps download speed, 300ms Round-Trip Time (RTT). Tested on EC2 on m3.medium instances, similar in performance to high-end smartphones, Jan. 2017.
[2] Google Data, Global, n=3,700 aggregated, anonymized Google Analytics data from a sample of mWeb sites opted into sharing benchmark data, Mar. 2016.
[3] https://support.google.com/analytics/answer/1205784?hl=en
[4] https://support.google.com/analytics/answer/2383341?hl=en