Over the past few years, the world of display ads has expanded to encompass a variety of ad types and demand-side platforms (DSPs), making it increasingly important to know how to fully analyze the effectiveness of your campaigns. Regardless of your strategy or preferred platforms, the end game is likely the same – drive awareness. The question is how do you know if you’re successful? You may think they’re working, but how can you prove it?
When it comes to proving value, you may often face one common question – “How much revenue did it drive?” Since display campaigns are often just the first step in a line of touch points, it can be difficult to identify the correlation between first impression and purchase. When it comes to quantifying the unquantifiable, we have to dig a bit deeper into the customer journey.
1. Ad Impressions and Branded Queries
Unable to tout a high conversion rate, many marketers resort to citing impressions as an indicator of display ad success. Not only does this spark more questions than answers, using impressions as a sole metric fails to take into account other important factors including budget, bids, reach, and frequency. However, looking at impressions in the context of other metrics provides deeper insights into the true effectiveness of your ads. With a primary goal of understanding a display campaign’s effect on brand awareness, we recommend taking a look at the correlation between display ad impressions and branded search queries over time.

In the example above, we see that as our ad impressions increase (blue line), so does the total number of impressions for branded search queries (orange line). This shows a correlation between the two metrics, ultimately meaning our ad spend is having a positive effect on brand awareness. Whether you see this trend within your own data currently or have yet to see a correlation, we recommend continuing to monitor the two metrics to better understand their relationship.
2. Conversion Paths
Since display campaigns don’t often drive last click revenue, it’s important to highlight their role in the overall user journey. Few tools are better at showing this than Google Analytics’ Top Conversion Paths report. Utilize the tools to understand what role your display campaigns play in driving revenue and use the information to optimize your campaigns accordingly. In the example below, we’ve filtered the data to only include conversion paths that included an interaction with one of our display ads. Here we can see that our Managed Placements campaign drove first-click conversions by driving users back to the site, primarily via organic and direct channels.

To take a deeper look, try adjusting the conversion window and filtering down to look at specific conversion goals to better understand user behaviors. We also recommend utilizing the Model Comparison Tool to identify how your campaigns are performing in the context of different attribution models.
3. Audience Insights
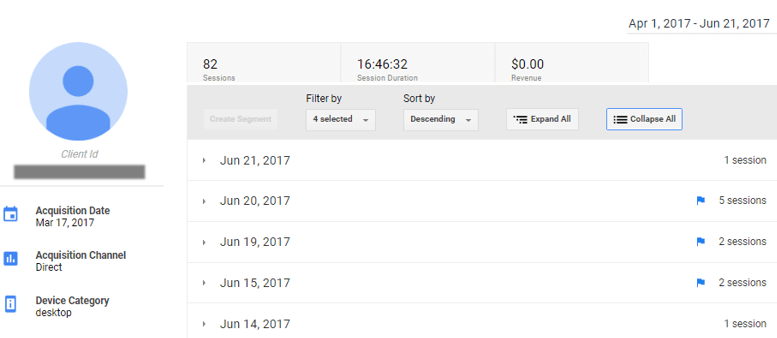
Over the past year, Google has worked to revamp the Google Analytics interface with a sleek new design and brand new reports. One of the most notable of these new reports is the User Explorer, which allows you to view user behavior at a micro level. The report provides a detailed look at a single user’s journey, including the day they first visited the site, what pages they viewed each day (and at what time!), which goals they completed, and what device they were using. From here, you can create segments combining users who have completed the same actions (viewed your home page, completed the contact form, etc.) to look at user behavior as a whole and better understand user trends in the context of your display campaigns.

User explorer report
The reports above may not answer all your questions, but they’ll help you better understand and show others how your ads are affecting other channels and what role they play in the user journey.
Need a hand measuring your digital campaign performance? Check out our Analytics and Measurement capabilities.

